home sweet home
A By-the-Numbers Look at Houston Real Estate
A primer on home prices, growth rate, square footage, and more per Bayou City neighborhood.

Image: nektofadeev/Shutterstock.com
All data comes from HAR's Multiple Listing Service (MLS). When neighborhood data was unavailable, ZIP code data was used, utilizing the ZIP with the highest percentage of the market in each neighborhood based on 2020 HAR data. N/A signifies that data was unavailable for the neighborhood or associated ZIP code.
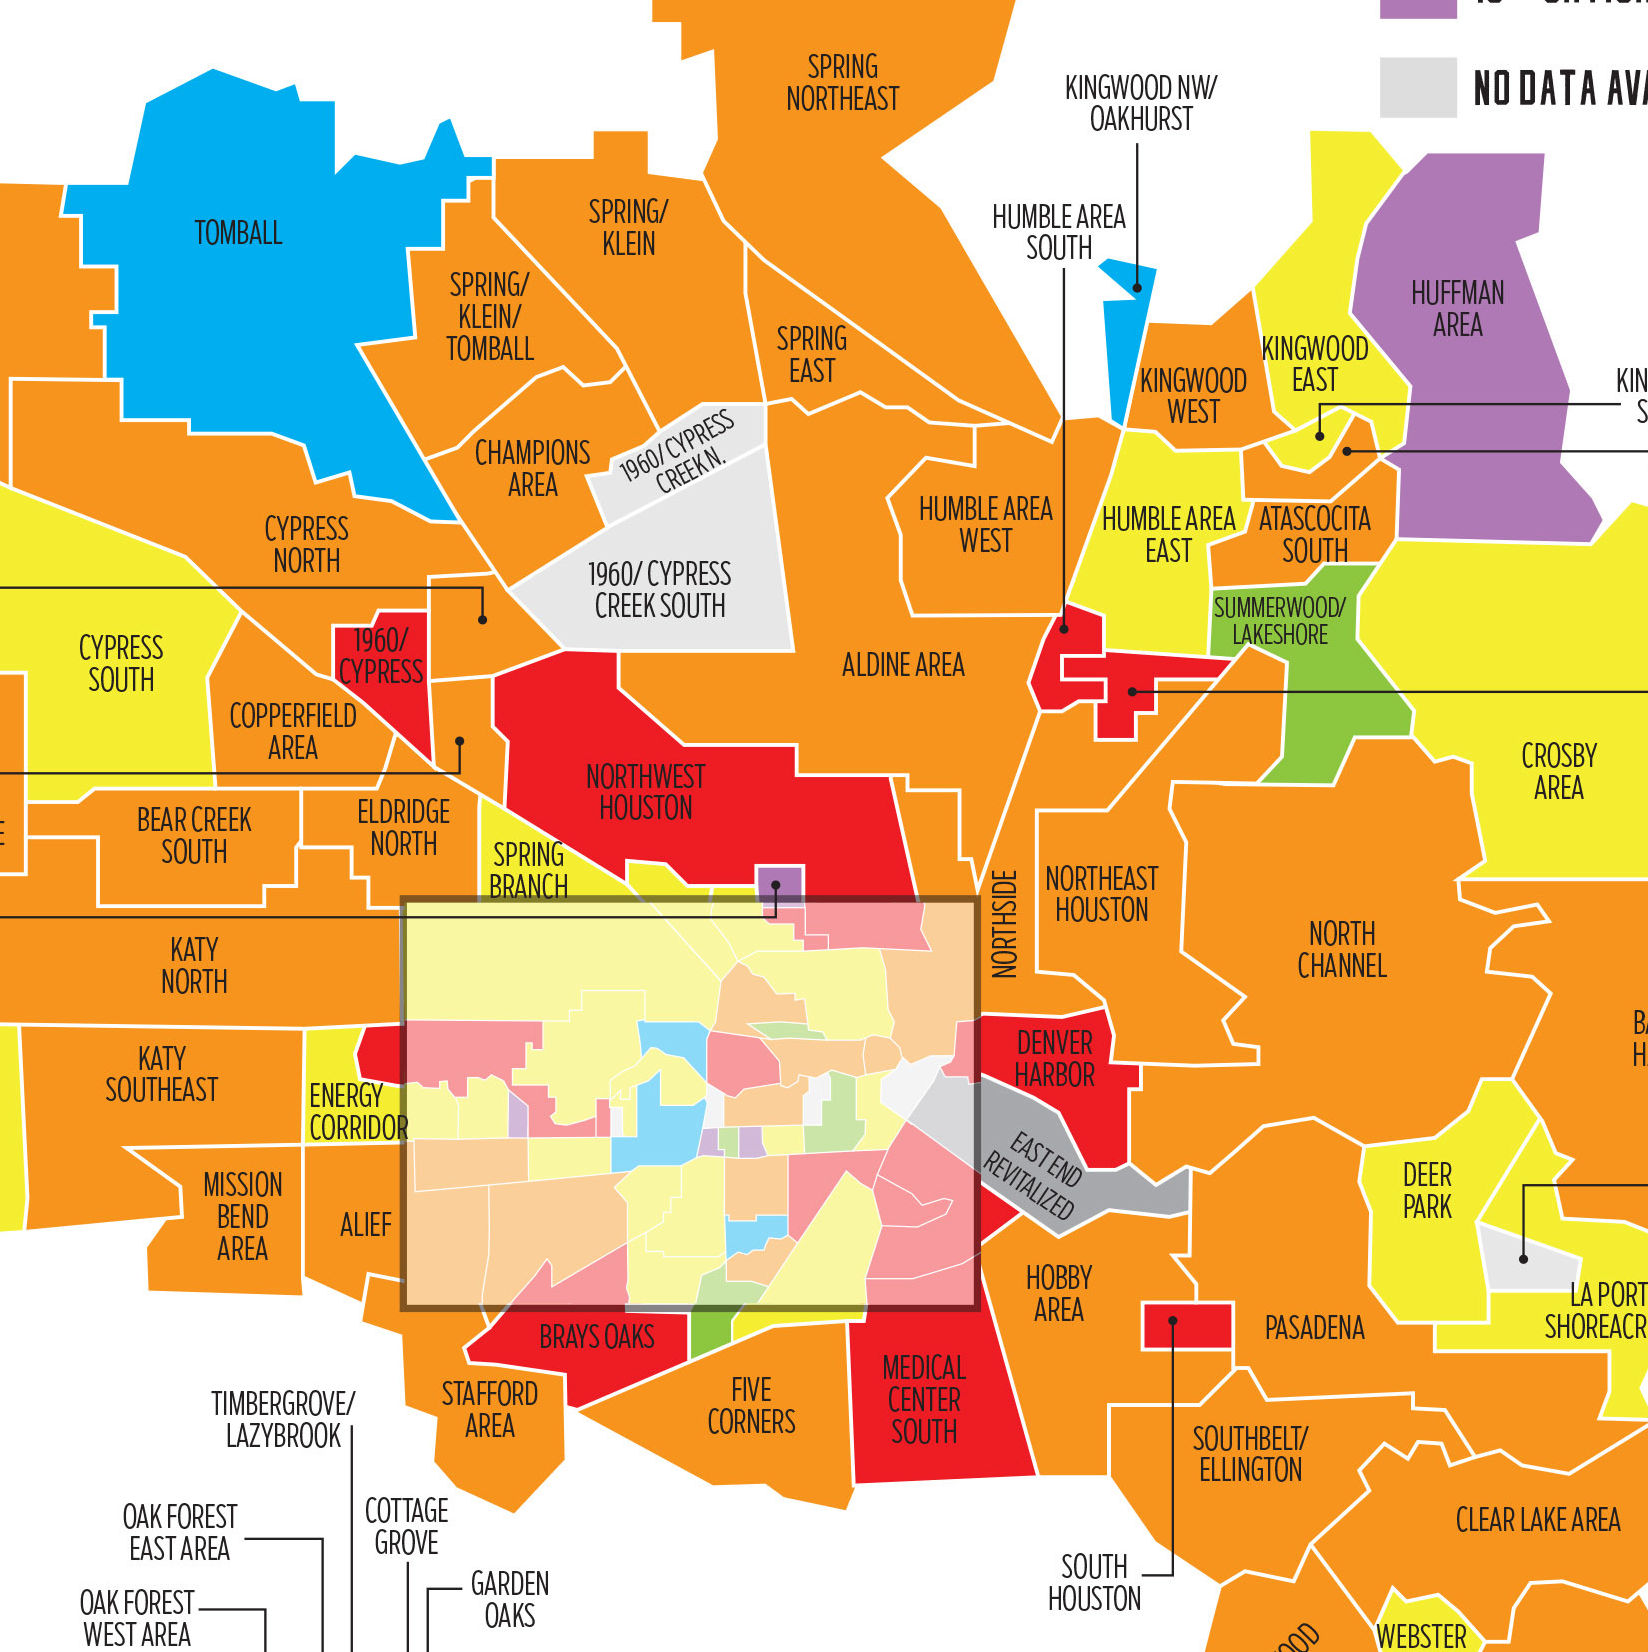
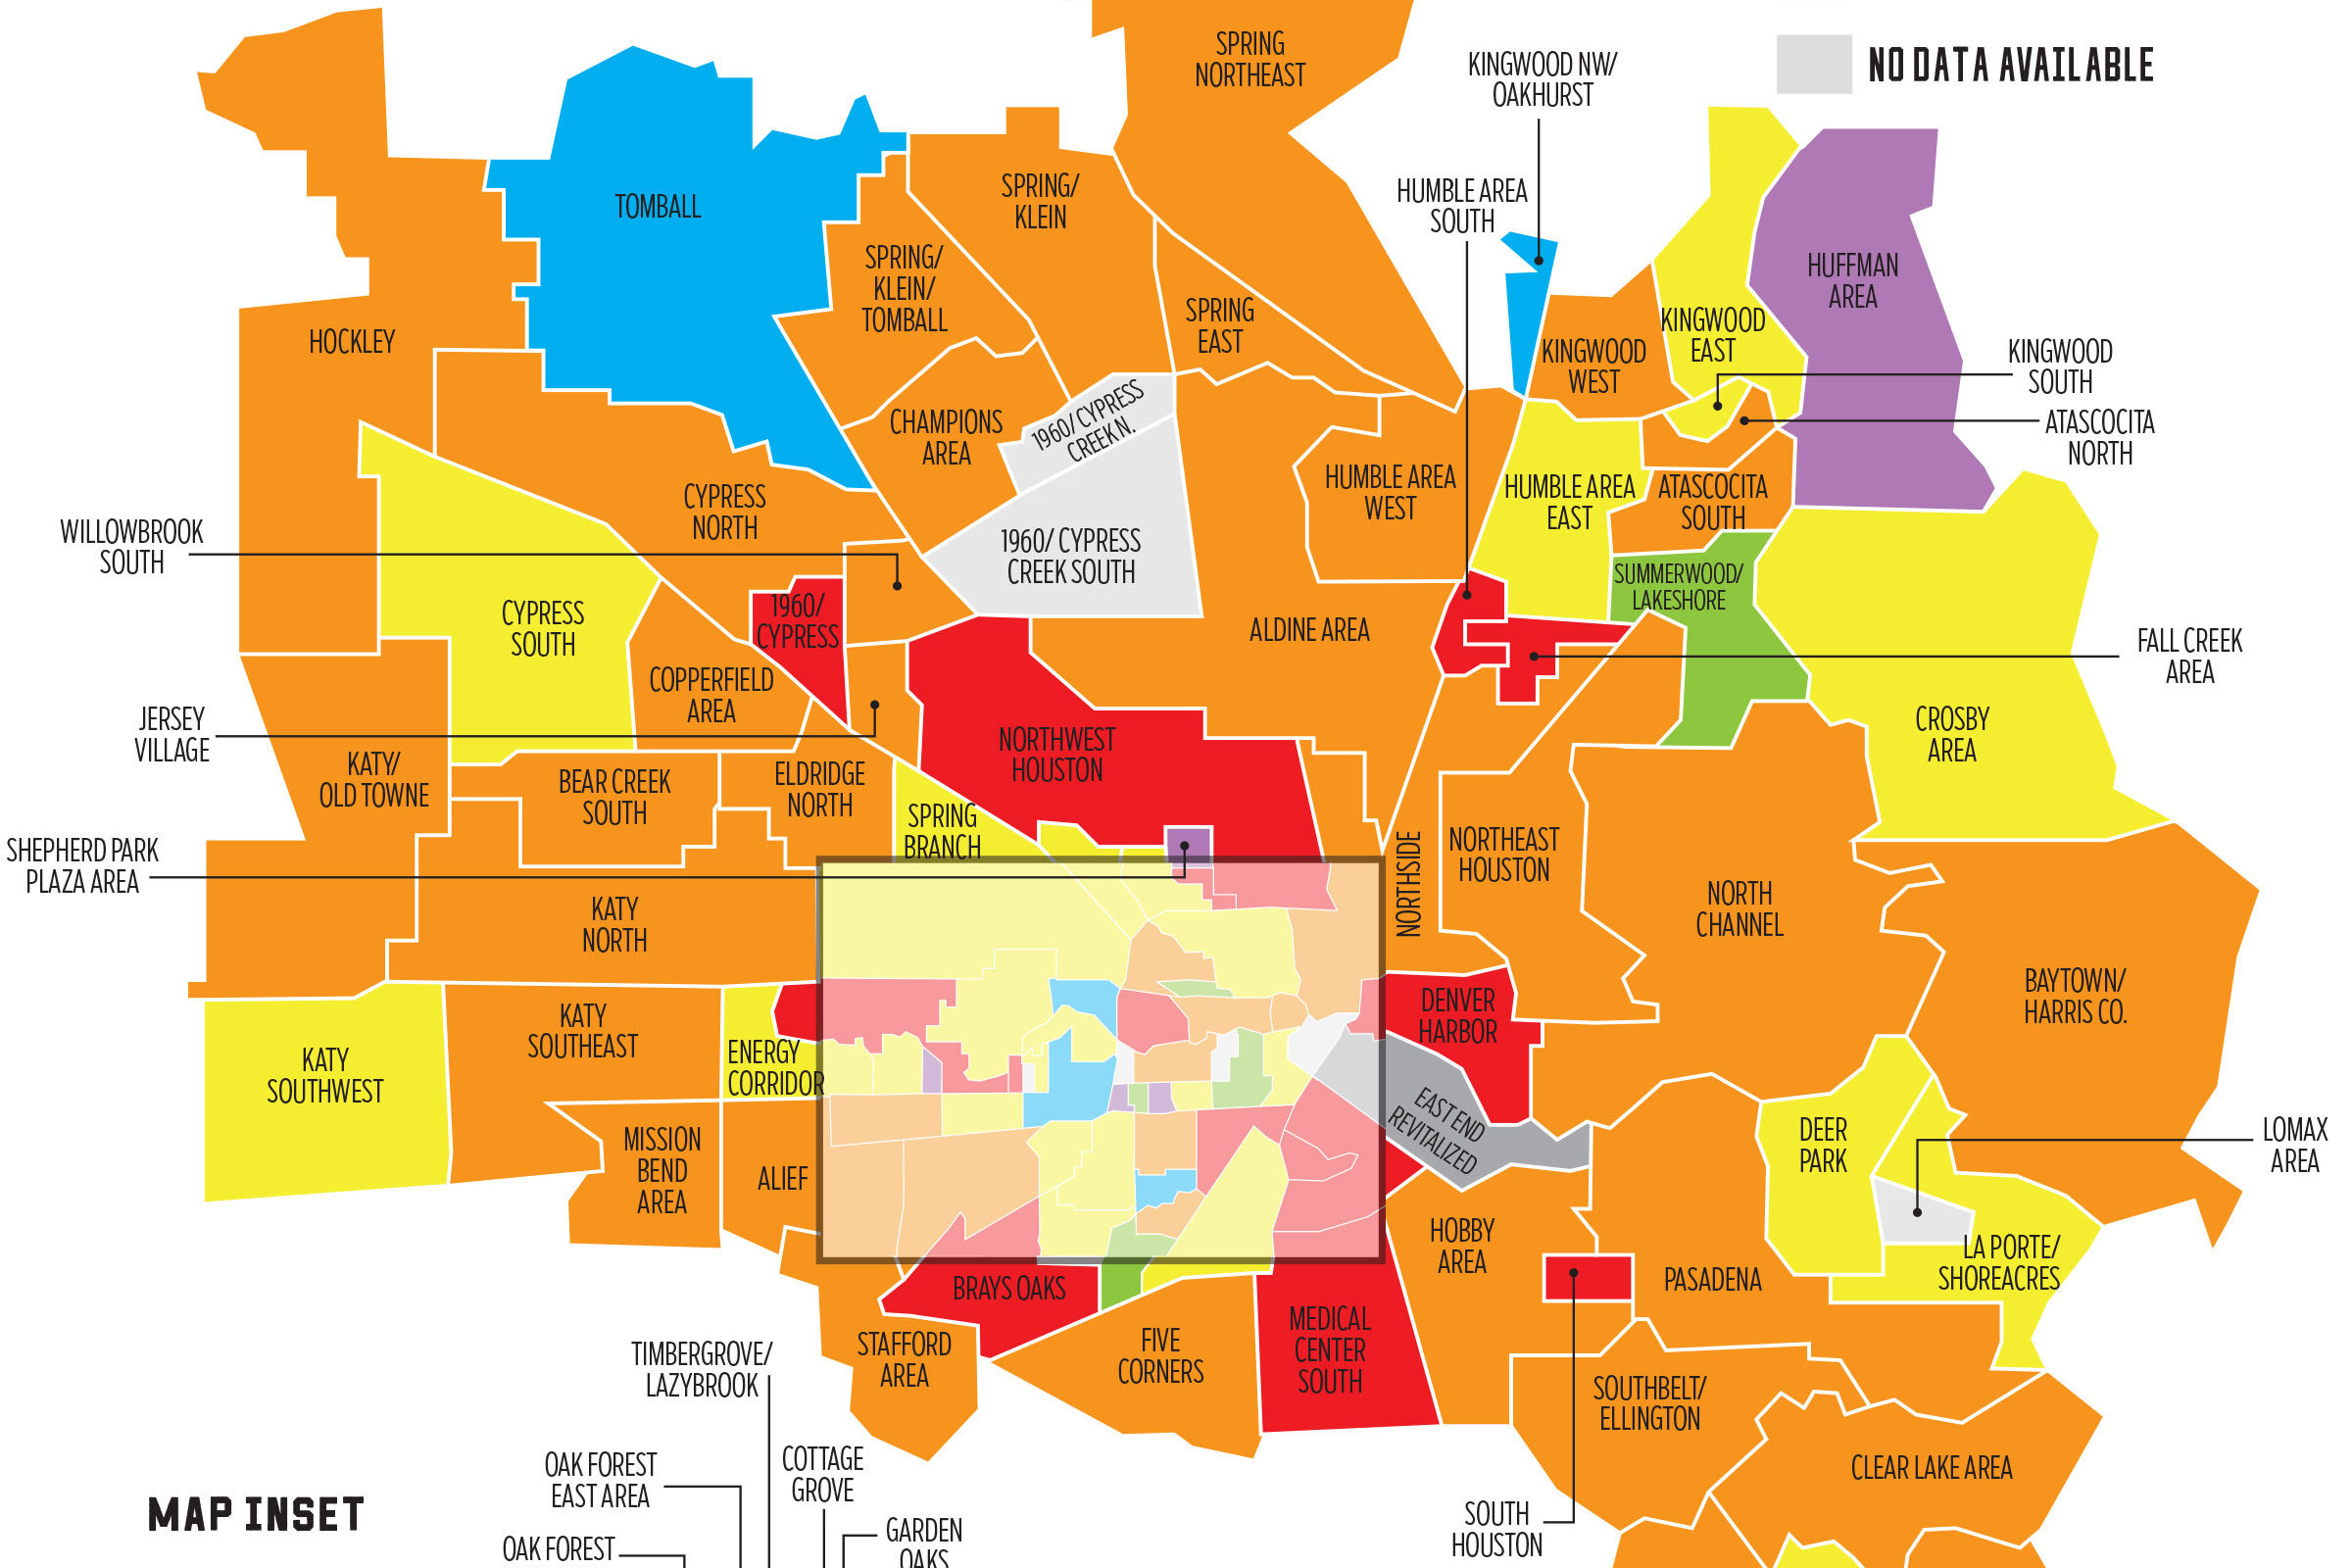
Also, take a look at our map of medium home prices.
| Neighborhood | ZIP | 2020 Median Home Price | 5-Year Percent Growth (2015-2020) | 1-Year Percent Growth (2019-2020) | Average Days on Market (2020) | Average Square Feet | Persons Per Houehold (ZIP) | Income Per Household (ZIP) | Owner vs. Renter Ratio (ZIP) |
|---|---|---|---|---|---|---|---|---|---|
| 1960/Cypress | 77065 | $225,000 | 36.40% | 11.60% | 26.7 | 2,279 | 2.58 | $75,972 | 0.87 : 1 |
| Aldine Area | 77073 | $174,990 | 41.10% | 9.40% | 33.5 | 1,859 | 3.53 | $63,540 | 1.45 : 1 |
| Alief | 77072 | $190,000 | 32.90% | 8.60% | 42.5 | 2,030 | 3.35 | $49,188 | 0.80 : 1 |
| Alvin North | 77583 | $287,879 | 33.90% | 3.90% | 71 | 2,482 | 3.37 | $101,590 | 6.03 : 1 |
| Alvin South | 77511 | $224,686 | 45.60% | 12.40% | 52.9 | 1,997 | 2.88 | $70,567 | 2.06 : 1 |
| Atascocita North | 77346 | $217,250 | 19.40% | 5.50% | 40.3 | 2,460 | 3.05 | $112,863 | 4.40 : 1 |
| Atascocita South | 77346 | $237,912 | 20.50% | 5.70% | 37.3 | 2,520 | 3.05 | $112,863 | 4.40 : 1 |
| Bacliff/San Leon | 77518 | $210,000 | 45.90% | 17.50% | 55.9 | 1,765 | 2.88 | $68,314 | 1.61 : 1 |
| Bayou Vista | 77563 | $303,000 | 46.50% | 12.20% | 66.6 | 1,562 | 2.48 | $66,976 | 2.38 : 1 |
| Baytown/Chambers County | 77523/77521 | $215,000 | 35.60% | 3.10% | 53.8 | 2,120 | 2.88 | $70,437 | 1.52 : 1 |
| Baytown/Harris County | 77521 | $195,250 | 38.50% | 8.50% | 45.4 | 1,922 | 2.88 | $70,437 | 1.52 : 1 |
| Bear Creek South | 77449 | $202,625 | 32.40% | 6.00% | 28.5 | 2,094 | 3.45 | $79,758 | 2.89 : 1 |
| Bellaire Area | 77401 | $860,000 | -7.00% | 1.90% | 72.9 | 3,743 | 2.81 | $227,530 | 4.94 : 1 |
| Braeswood Place | 77025 | $744,500 | 5.60% | -6.90% | 58.7 | 3,411 | 2.15 | $117,964 | 0.70 : 1 |
| Brays Oaks | 77035 | $239,250 | 17.00% | 12.70% | 48.4 | 2,085 | 2.73 | $66,163 | 0.74 : 1 |
| Briargrove | 77057 | $859,500 | 7.40% | 2.40% | 53.2 | 3,271 | 2.06 | $93,612 | 0.43 : 1 |
| Briargrove Park/WalnutBend | 77042 | $456,000 | 5.90% | 0.40% | 52.7 | 2,547 | 2.11 | $75,097 | 0.32 : 1 |
| Briarmeadow/Tanglewilde | 77063 | $330,000 | 12.60% | 3.70% | 56.4 | 2,107 | 2.01 | $74,875 | 0.34 : 1 |
| Brookshire | 77493 | $207,900 | -15.10% | 9.50% | 47.2 | 1,908 | 3.17 | $95,043 | 4.10 : 1 |
| Chambers County East | 77514 | $203,995 | 65.10% | 22.50% | 68.4 | 1,754 | NA | NA | NA |
| Chambers County West | 77523 | $331,155 | 32.00% | 15.20% | 55.1 | 2,515 | 2.88 | $70,437 | 1.52 : 1 |
| Champions Area | 77379 | $256,100 | 15.40% | 5.70% | 43 | 2,935 | 2.95 | $133,039 | 3.69 : 1 |
| Charnwood/Briarbend | 77063 | $885,000 | 9.70% | 26.40% | 40.4 | 3,059 | 2.01 | $74,875 | 0.34 : 1 |
| Clear Lake Area | 77062 | $285,000 | 26.50% | 7.50% | 42.8 | 2,574 | 2.67 | $110,419 | 2.62 : 1 |
| Cleveland Area | 77327 | $186,000 | 65.30% | 9.40% | 58.9 | 1,763 | 2.77 | $58,449 | 2.48 : 1 |
| Coldspring/South San Jacinto County | 77371/ 77328 | $150,000 | 25.00% | 11.90% | 199.3 | 2,021 | 2.98 | $63,176 | 4.13 : 1 |
| Conroe Northeast | 77303 | $208,000 | 31.90% | 9.50% | 47.7 | 1,967 | 2.91 | $58,765 | 2.36 : 1 |
| Conroe Southeast | 77301 | $225,000 | 30.10% | 3.20% | 41.8 | 2,278 | 3.13 | $47,817 | 0.87 : 1 |
| Conroe Southwest | 77316 | $355,950 | 4.70% | 5.50% | 64.3 | 2,881 | 2.85 | $105,178 | 5.37 : 1 |
| Copperfield Area | 77095 | $245,000 | 25.60% | 7.50% | 26.9 | 2,466 | 2.93 | $114,679 | 2.44 : 1 |
| Cottage Grove | 77007 | $411,500 | 2.80% | -0.40% | 49.5 | 2,278 | 1.93 | $129,232 | 0.81 : 1 |
| Crosby Area | 77532 | $216,090 | 35.10% | 3.00% | 48.4 | 2,050 | 2.91 | $82,715 | 3.52 : 1 |
| Crystal Beach | 77650 | $325,000 | 34.00% | 15.00% | 125.2 | 1,497 | 2.17 | $65,835 | 3.85 : 1 |
| Cypress North | 77429 | $275,000 | 18.30% | 5.80% | 33.3 | 2,847 | 3.02 | $128,195 | 4.26 : 1 |
| Cypress South | 77433 | $322,000 | 17.20% | 3.90% | 46.7 | 2,820 | 3.3 | $123,038 | 6.44 : 1 |
| Dayton | 77535 | $229,000 | 76.30% | 11.20% | 57.4 | 1,907 | 2.9 | $70,686 | 3.64 : 1 |
| Deer Park | 77536 | $219,000 | 31.90% | 3.80% | 28.5 | 1,990 | 2.89 | $94,069 | 3.00 : 1 |
| Denver Harbor | 77020 | $279,000 | 228.20% | 34.50% | 45.1 | 1,650 | 3.23 | $42,733 | 0.82 : 1 |
| Dickinson | 77539 | $229,165 | 43.70% | 14.70% | 43.9 | 2,095 | 2.79 | $77,763 | 2.42 : 1 |
| East End | 77550 | $250,000 | 56.70% | 13.60% | 61.3 | 1,832 | 2.24 | $49,720 | 0.60 : 1 |
| East End Revitalized | 77003 | $298,000 | 35.50% | 0.00% | 54.7 | 1,700 | 2.4 | $59,438 | 0.51 : 1 |
| Eldridge North | 77041 | $260,000 | 22.60% | 9.70% | 38.2 | 2,779 | 3.25 | $103,063 | 2.58 : 1 |
| Energy Corridor | 77077 | $339,500 | -1.60% | 1.30% | 59.4 | 2,700 | 2.15 | $97,683 | 0.61 : 1 |
| Fall Creek Area | 77396 | $334,500 | 10.30% | 10.00% | 48.9 | 3,427 | 3.09 | $83,212 | 1.73 : 1 |
| Five Corners | 77045 | $180,000 | 38.50% | 5.90% | 26.9 | 1,687 | 3.52 | $52,065 | 1.93 : 1 |
| Fort Bend County North/Richmond | 77406 | $284,000 | 13.60% | 3.60% | 49 | 2,678 | 2.83 | $146,836 | 6.90 : 1 |
| Fort Bend Southeast | 77469 | $350,000 | -21.80% | -8.80% | 88.9 | 2,970 | 2.99 | $98,450 | 2.43 : 1 |
| Friendswood | 77546 | $295,000 | 40.80% | 5.40% | 34.5 | 2,724 | 2.88 | $124,240 | 3.43 : 1 |
| Fulshear/South Brookshire/Simonton | 77423 | $332,000 | -18.80% | -7.60% | 77.5 | 2,861 | 3.13 | $68,721 | 2.09 : 1 |
| Galleria | 77056 | $572,800 | -13.90% | -8.80% | 75.9 | 3,179 | 1.82 | $144,671 | 0.71 : 1 |
| Garden Oaks | 77018 | $545,000 | 24.40% | 21.10% | 43.4 | 2,424 | 2.39 | $86,976 | 1.97 : 1 |
| Greenway Plaza | 77027 | $644,000 | 25.00% | -26.00% | 30.8 | 2,671 | 1.67 | $137,324 | 0.46 : 1 |
| Gulfton | 77081 | $205,500 | -19.40% | 1.20% | 55 | 1,644 | 2.9 | $41,434 | 0.06 : 1 |
| Heights/Greater Heights | 77008 | $520,000 | 13.00% | 1.00% | 42.9 | 2,245 | 2.07 | $104,060 | 1.03 : 1 |
| Hempstead | 77445 | $162,000 | 47.30% | 17.80% | 69.4 | 1,780 | 2.69 | $57,115 | 1.43 : 1 |
| Highland Village/Midlane | 77027 | $982,100 | 27.50% | -0.80% | 59.1 | 2,952 | 1.67 | $137,324 | 0.46 : 1 |
| Hitchcock | 77563 | $148,000 | 13.00% | 13.80% | 58.1 | 1,590 | 2.48 | $66,976 | 2.38 : 1 |
| Hobby Area | 77034 | $175,000 | 60.60% | 9.40% | 39.9 | 1,706 | 3.2 | $55,506 | 1.01 : 1 |
| Hockley | 77447 | $231,900 | 66.80% | 7.90% | 45.7 | 1,997 | 3.08 | $83,392 | 3.85 : 1 |
| Huffman Area | 77336 | $230,000 | 17.00% | -11.50% | 60.3 | 2,224 | 2.96 | $88,015 | 3.73 : 1 |
| Humble Area East | 77396 | $203,900 | 35.90% | 4.60% | 37.1 | 2,032 | 3.09 | $83,212 | 1.73 : 1 |
| Humble Area South | 77396 | $139,950 | 108.10% | 21.70% | 12.6 | 1,407 | 3.09 | $83,212 | 1.73 : 1 |
| Humble Area West | 77338 | $180,000 | 37.10% | 5.30% | 29.9 | 1,959 | 2.94 | $63,139 | 1.13 : 1 |
| Jersey Village | 77064 | $260,000 | 16.50% | 6.10% | 34.3 | 2,470 | 3.02 | $84,482 | 1.56 : 1 |
| Katy - North | 77449 | $216,900 | 26.10% | 6.30% | 30.5 | 2,190 | 3.45 | $79,758 | 2.89 : 1 |
| Katy - Old Towne | 77493 | $290,000 | 28.90% | 5.50% | 68.7 | 2,578 | 3.17 | $95,043 | 4.10 : 1 |
| Katy - Southeast | 77450 | $303,000 | 7.10% | 5.70% | 36.5 | 2,848 | 2.92 | $130,240 | 2.34 : 1 |
| Katy - Southwest | 77494 | $349,990 | 0.00% | 3.90% | 49.2 | 3,128 | 3.25 | $153,079 | 4.66 : 1 |
| Kingwood East | 77345 | $312,250 | 7.70% | 2.20% | 54.3 | 3,033 | 2.88 | $162,702 | 5.73 : 1 |
| Kingwood NW/Oakhurst | 77365 | $245,500 | -8.20% | -6.50% | 50.3 | 2,522 | 3 | $76,870 | 2.47 : 1 |
| Kingwood South | 77346 | $262,500 | 17.50% | 1.00% | 45.2 | 2,953 | 3.05 | $112,863 | 4.40 : 1 |
| Kingwood West | 77339 | $221,000 | 20.90% | 5.10% | 40.6 | 2,397 | 2.46 | $99,113 | 1.67 : 1 |
| Knollwood/Woodside Area | 77025 | $437,500 | -5.90% | 9.40% | 58 | 2,548 | 2.15 | $117,964 | 0.70 : 1 |
| La Marque | 77568 | $200,000 | 117.40% | 8.10% | 45.5 | 1,817 | 2.65 | $61,332 | 2.06 : 1 |
| La Porte/Shoreacres | 77571 | $203,250 | 38.30% | 4.20% | 36.7 | 1,858 | 2.84 | $78,565 | 2.62 : 1 |
| Lake Conroe Area | 77356 | $265,000 | 17.80% | 4.60% | 61.3 | 2,495 | 2.48 | $121,791 | 4.79 : 1 |
| Lake Livingston Area | 77351 | $195,000 | 69.60% | 34.50% | 101 | 1,836 | NA | NA | NA |
| League City | 77573 | $292,990 | 27.10% | 7.50% | 38.2 | 2,572 | 2.83 | $108,940 | 2.87 : 1 |
| Liberty | 77575 | $159,000 | 32.50% | 25.20% | 63.9 | 1,836 | 2.68 | $66,349 | 2.73 : 1 |
| Magnolia/1488 East | 77354 | $329,900 | 26.70% | 2.80% | 54.7 | 2,684 | 3.05 | $116,032 | 6.32 : 1 |
| Magnolia/1488 West | 77355 | $264,098 | 12.40% | 5.30% | 57.9 | 2,596 | 3.01 | $90,758 | 4.32 : 1 |
| Medical Center Area | 77054 | $318,850 | -7.60% | 0.30% | 65.2 | 1,960 | 1.75 | $59,124 | 0.20 : 1 |
| Medical Center South | 77033 | $185,000 | 60.90% | 17.80% | 37.2 | 1,651 | 3.11 | $40,713 | 1.54 : 1 |
| Memorial Close In | 77024 | $1,652,975 | -10.70% | -5.10% | 74.3 | 5,877 | 2.4 | $190,577 | 2.05 : 1 |
| Memorial Park | 77007 | $1,495,000 | 15.90% | 32.50% | 118.6 | 4,517 | 1.93 | $129,232 | 0.81 : 1 |
| Memorial Villages | 77024 | $1,500,000 | -6.60% | 1.30% | 73 | 4,790 | 2.4 | $190,577 | 2.05 : 1 |
| Memorial West | 77079 | $730,000 | 4.30% | 11.50% | 57.5 | 3,230 | 2.55 | $147,997 | 1.55 : 1 |
| Meyerland Area | 77096 | $365,000 | -13.30% | 4.00% | 77 | 2,569 | 2.4 | $100,166 | 0.92 : 1 |
| Midtown - Galveston | 77551 | $212,000 | 70.30% | 16.20% | 48.7 | 1,547 | 2.43 | $60,832 | 0.93 : 1 |
| Midtown - Houston | 77004 | $430,000 | -2.10% | 2.40% | 66.9 | 2,245 | 2.01 | $68,426 | 0.39 : 1 |
| Mission Bend Area | 77083 | $214,000 | 37.30% | 6.80% | 34.8 | 2,099 | 3.49 | $74,577 | 2.23 : 1 |
| Missouri City Area | 77459 | $227,000 | 30.50% | 6.00% | 42.3 | 2,335 | 3.01 | $132,056 | 7.19 : 1 |
| Montrose | 77006 | $655,000 | 2.70% | -0.80% | 54.4 | 2,752 | 1.63 | $105,399 | 0.46 : 1 |
| Near West End | 77551 | $318,500 | 69.90% | 19.10% | 73.1 | 2,192 | 2.43 | $60,832 | 0.93 : 1 |
| North Channel | 77049 | $179,000 | 43.20% | 5.40% | 34.1 | 1,870 | 3.34 | $66,020 | 1.99 : 1 |
| Northeast Houston | 77044 | $148,400 | 66.70% | 8.50% | 44.9 | 1,494 | 3.32 | $95,635 | 3.68 : 1 |
| Northside | 77009 | $180,000 | 95.70% | 8.50% | 57.9 | 1,486 | 2.72 | $69,391 | 0.96 : 1 |
| Northwest Houston | 77088 | $195,000 | 52.30% | 11.40% | 48.4 | 1,769 | 3.21 | $52,744 | 1.46 : 1 |
| Oak Forest East Area | 77018 | $450,000 | 13.60% | 4.80% | 45.8 | 2,388 | 2.39 | $86,976 | 1.97 : 1 |
| Oak Forest West Area | 77092 | $289,150 | 16.10% | 3.30% | 47.7 | 1,778 | 2.7 | $51,403 | 0.68 : 1 |
| Omega Bay | 77568 | $379,500 | 35.50% | 9.20% | 70.4 | 1,746 | 2.65 | $61,332 | 2.06 : 1 |
| Pasadena | 77502 | $180,500 | 43.30% | 9.40% | 31.4 | 1,814 | 3.4 | $53,159 | 1.41 : 1 |
| Pearland | 77584 | $277,500 | 15.70% | 2.80% | 39.7 | 2,568 | 2.98 | $120,868 | 3.43 : 1 |
| Plantersville Area | 77363 | $235,000 | 81.50% | 27.00% | 75.5 | 1,879 | NA | NA | NA |
| Porter/New Caney East | 77357 | $237,585 | 2.00% | -0.40% | 65.5 | 2,261 | 2.99 | $67,883 | 3.00 : 1 |
| Porter/New Caney West | 77365 | $217,765 | 15.30% | 1.30% | 51.1 | 2,190 | 3 | $76,870 | 2.47 : 1 |
| Rice Military/Washington Corridor | 77007 | $470,000 | 0.00% | 1.10% | 67.6 | 2,432 | 1.93 | $129,232 | 0.81 : 1 |
| Rice/Museum District | 77030 | $950,000 | 27.50% | 11.80% | 61.1 | 3,248 | 2.05 | $150,138 | 0.70 : 1 |
| River Oaks Area | 77019 | $2,325,000 | 20.70% | 8.30% | 91 | 5,336 | 1.88 | $150,345 | 0.77 : 1 |
| Rivercrest | 77042 | $2,910,000 | 5.40% | -14.60% | 194.8 | 9,237 | 2.11 | $75,097 | 0.32 : 1 |
| Riverside | 77004 | $359,000 | 12.60% | 12.20% | 68.9 | 2,560 | 2.01 | $68,426 | 0.39 : 1 |
| Royden Oaks/Afton Oaks | 77027 | $845,000 | 5.60% | -11.50% | 49.4 | 3,513 | 1.67 | $137,324 | 0.46 : 1 |
| Santa Fe | 77510 | $250,000 | 48.50% | 13.60% | 53.1 | 1,915 | 2.69 | $83,149 | 3.78 : 1 |
| Sharpstown Area | 77036 | $215,000 | 23.00% | 7.50% | 51.8 | 1,886 | 2.91 | $41,422 | 0.22 : 1 |
| Shepherd Park Plaza Area | 77018 | $344,900 | -17.10% | -18.40% | 54 | 1,982 | 2.39 | $86,976 | 1.97 : 1 |
| Sienna Area | 77459 | $329,000 | -7.30% | 0.90% | 64.2 | 3,052 | 3.01 | $132,056 | 7.19 : 1 |
| South Houston | 77587 | $155,000 | 57.40% | 19.20% | 42.2 | 1,404 | 3.57 | $49,362 | 1.15 : 1 |
| Southbelt/Ellington | 77089 | $205,000 | 37.60% | 7.10% | 32.6 | 1,982 | 3.07 | $76,886 | 1.97 : 1 |
| Spring Branch | 77080 | $343,000 | 8.90% | 3.40% | 60.8 | 2,198 | 3.12 | $52,618 | 0.58 : 1 |
| Spring East | 77373 | $182,700 | 30.60% | 5.60% | 31.6 | 1,977 | 3.05 | $82,637 | 2.49 : 1 |
| Spring Northeast | 77386 | $290,668 | 31.20% | 6.50% | 47.9 | 2,700 | 3.09 | $116,556 | 4.11 : 1 |
| Spring/Klein | 77388 | $250,000 | 25.00% | 7.30% | 36.4 | 2,613 | 2.97 | $105,122 | 5.14 : 1 |
| Spring/Klein/Tomball | 77375 | $255,000 | 27.50% | 6.70% | 37.2 | 2,691 | 2.94 | $92,378 | 2.45 : 1 |
| Stafford Area | 77477 | $195,000 | 38.50% | 5.60% | 34.4 | 2,065 | 2.69 | $73,556 | 0.76 : 1 |
| Sugar Land East | 77478 | $316,900 | 0.30% | -4.30% | 48.8 | 2,741 | 2.62 | $124,893 | 2.63 : 1 |
| Sugar Land North | 77498 | $254,750 | 14.40% | -2.20% | 49.2 | 2,453 | 3.2 | $99,109 | 2.85 : 1 |
| Sugar Land South | 77479 | $435,000 | -4.30% | 3.30% | 57.2 | 3,465 | 3.12 | $161,420 | 5.89 : 1 |
| Sugar Land West | 77479 | $344,450 | 9.30% | 6.00% | 53.4 | 3,055 | 3.12 | $161,420 | 5.89 : 1 |
| Summerwood/Lakeshore | 77044 | $296,575 | 12.00% | -0.50% | 67 | 2,779 | 3.32 | $95,635 | 3.68 : 1 |
| Tanglewood Area | 77056 | $1,570,000 | -1.80% | 1.40% | 87.7 | 5,215 | 1.82 | $144,671 | 0.71 : 1 |
| Texas City | 77590 | $199,000 | 114.00% | 6.00% | 49.8 | 1,861 | 2.72 | $56,745 | 1.37 : 1 |
| The Woodlands | 77382 | $410,000 | 8.00% | 10.80% | 43 | 3,190 | 2.99 | $161,260 | 3.48 : 1 |
| Tiki Island | 77554 | $604,000 | 33.00% | 16.50% | 100.8 | 2,343 | 2.02 | $99,228 | 1.68 : 1 |
| Timbergrove/Lazybrook | 77008 | $488,617 | 20.60% | 8.60% | 49.6 | 2,272 | 2.07 | $104,060 | 1.03 : 1 |
| Tomball | 77375 | $305,000 | 38.60% | -7.60% | 56 | 2,711 | 2.94 | $92,378 | 2.45 : 1 |
| Treasure Island | 77541 | $338,000 | 35.20% | 17.60% | 90.7 | 1,576 | 2.9 | $51,331 | 1.56 : 1 |
| University Area | 77004 | $235,350 | 97.80% | 25.50% | 63.4 | 1,687 | 2.01 | $68,426 | 0.39 : 1 |
| Upper Kirby | 77098 | $854,000 | 11.30% | 4.00% | 76.6 | 3,370 | 1.65 | $114,226 | 0.33 : 1 |
| Waller | 77484 | $270,000 | 50.80% | 17.60% | 58.7 | 2,149 | 2.82 | $78,735 | 2.26 : 1 |
| Washington East/Sabine | 77007 | $440,000 | 6.30% | 6.80% | 43.5 | 2,182 | 1.93 | $129,232 | 0.81 : 1 |
| Webster | 77598 | $348,921 | 48.50% | 0.40% | 63 | 2,706 | 2.18 | $62,062 | 0.26 : 1 |
| West End | 77554 | $425,000 | 36.10% | 16.40% | 68.7 | 1,767 | 2.02 | $99,228 | 1.68 : 1 |
| West University/Southside Area | 77005 | $1,360,000 | 11.20% | 7.90% | 59.6 | 3,768 | 2.46 | $221,568 | 2.28 : 1 |
| Westchase Area | 77082 | $590,000 | -16.20% | 6.90% | 99.7 | 3,558 | 2.47 | $72,973 | 0.52 : 1 |
| Willis Area | 77378 | $183,000 | 30.70% | 10.90% | 44.8 | 1,649 | 3.06 | $61,231 | 2.53 : 1 |
| Willow Meadows Area | 77035 | $292,000 | -7.40% | -1.40% | 59.4 | 2,015 | 2.73 | $66,163 | 0.74 : 1 |
| Willowbrook South | 77064 | $195,000 | 34.50% | 8.40% | 25.8 | 1,920 | 3.02 | $84,482 | 1.56 : 1 |