Neighborhoods by the Numbers 2016

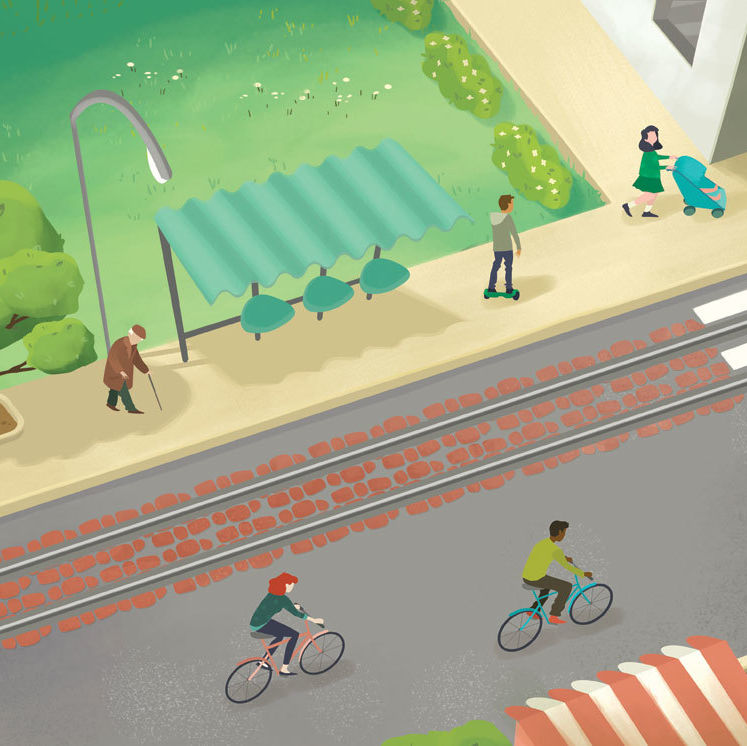
Image: Dan Derozier and Jill Hunter
From average commute time to the number of nearby parks, here's everything you need to know about Houston's 149 neighborhoods, broken down into four handy sections: Real Estate Data, Demographics, Transportation and Lifestyle.
Real Estate Data
| ZIP Code | 2015 Median Home Price | % Growth 2010-2015 | % Growth 2014-2015 | Avg. Days on Market in 2015 | % Owner Occupied | |
|---|---|---|---|---|---|---|
| 1960/Cypress | 77065 | $165,000 | 34.10% | 10.00% | 25.8 | 47% |
| Aldine Area | 77039 | $124,000 | 45.90% | 10.20% | 43.3 | 61% |
| Alief | 77072 | $143,000 | 57.10% | 12.80% | 31.5 | 47% |
| Alvin North | 77511 | $214,998 | 35.80% | 11.10% | 59.9 | 71% |
| Alvin South | 77511 | $154,350 | 37.80% | 10.30% | 42.8 | 71% |
| Angelina County | 75901 | $182,000 | 40.00% | 7.10% | 33.4 | 63% |
| Atascocita North | 77346 | $197,500 | 31.70% | 12.20% | 36.3 | 82% |
| Atascocita South | 77396 | $143,900 | 50.80% | 3.90% | 65.3 | 63% |
| Bacliff/San Leon | 77518 | $206,850 | 37.90% | 7.50% | 74 | 67% |
| Bayou Vista | 77563 | $158,600 | 29.80% | 10.90% | 38.5 | 69% |
| Baytown/Chambers County | 77521 | $141,000 | 39.70% | 12.00% | 48 | 64% |
| Baytown/Harris County | 77520 | $153,000 | 45.70% | 13.30% | 26.1 | 61% |
| Bear Creek | 77449 | $925,000 | 32.10% | 4.90% | 42.7 | 74% |
| Bellaire | 77401 | $705,000 | 56.30% | 0.70% | 38.9 | 82% |
| Braeswood Place | 77025 | $204,500 | 61.00% | 8.80% | 31.2 | 45% |
| Brays Oaks | 77031 | $800,000 | 46.70% | 3.00% | 34.4 | 43% |
| Briargrove | 77057 | $430,750 | 53.80% | 13.10% | 34.9 | 32% |
| Briargrove Park/Walnut Bend | 77042 | $293,000 | 56.10% | 11.00% | 29 | 28% |
| Briarmeadow/Tanglewilde | 77063 | $245,000 | 61.70% | 53.10% | 57.6 | 27% |
| Brookshire | 77423 | $123,550 | 6.50% | 1.30% | 71.7 | 62% |
| Chambers County East | 77514 | $250,939 | 34.70% | 2.80% | 63.4 | 79% |
| Chambers County West | 77523 | $222,000 | 26.90% | 5.70% | 41 | 83% |
| Champions Area | 77069 | $807,000 | 88.30% | 8.30% | 86.6 | 60% |
| Charnwood/Briarbend | 77063 | $225,250 | 25.70% | 14.60% | 35 | 27% |
| Clear Lake Area | 77062 | $112,500 | 70.50% | 12.50% | 87.9 | 78% |
| Cleveland Area | 77327 | $120,000 | 71.40% | 25.00% | 90.4 | 74% |
| Coldspring/South San Jacinto County | 77331 | $157,700 | 60.10% | 16.00% | 56 | 87% |
| Conroe Northeast | 77301 | $173,000 | 33.50% | 11.10% | 46.7 | 49% |
| Conroe Southeast | 77301 | $339,875 | 44.60% | 0.00% | 62.7 | 49% |
| Conroe Southwest | 77304 | $195,000 | 27.50% | 5.40% | 25.3 | 57% |
| Copperfield Area | 77095 | $400,226 | 51.10% | 3.90% | 56.3 | 72% |
| Cottage Grove | 77007 | $159,900 | 28.00% | 2.50% | 42.7 | 50% |
| Crosby Area | 77532 | $242,500 | 14.40% | 3.20% | 113.9 | 80% |
| Crystal Beach | 77650 | $232,412 | 32.80% | 5.60% | 35.9 | 91% |
| Cypress North | 77429 | $274,700 | 72.80% | 11.30% | 59 | 82% |
| Cypress South | 77433 | $129,900 | 13.20% | 1.50% | 54.5 | 83% |
| Dayton | 77535 | $166,000 | 23.00% | 7.10% | 26.6 | 80% |
| Deer Park | 77536 | $85,000 | 105.90% | 23.20% | 49.4 | 76% |
| Denver Harbor | 77020 | $159,450 | 21.10% | 16.40% | 54.3 | 48% |
| Dickinson | 77539 | $159,500 | 32.90% | 7.80% | 60.5 | 71% |
| East End-Galveston | 77550 | $212,000 | 4.40% | 12.80% | 32.5 | 40% |
| Eldridge North | 77041 | $345,000 | 46.70% | 7.80% | 36 | 79% |
| Energy Corridor | 77077 | $303,371 | 16.70% | 0.60% | 41.9 | 38% |
| Fall Creek Area | 77396 | $130,000 | 44.40% | 7.20% | 42.8 | 63% |
| Five Corners | 77045 | $250,000 | 38.20% | 6.40% | 50.8 | 68% |
| Fort Bend County North/Richmond | 77469 | $447,825 | 40.40% | 35.20% | 46.3 | 73% |
| Fort Bend Southeast | 77469 | $209,500 | 21.40% | 3.20% | 32.7 | 73% |
| Friendswood | 77546 | $409,000 | 15.30% | 2.30% | 70.5 | 80% |
| Fulshear/South Brookshire/Simonton | 77441 | $665,000 | 38.50% | 7.70% | 53.8 | 93% |
| Galleria | 77056 | $438,125 | 62.30% | 14.70% | 42.3 | 46% |
| Garden Oaks | 77015 | $515,000 | 42.50% | -33.50% | 19.3 | 53% |
| Greenway Plaza | 77046 | $255,000 | -16.90% | 59.30% | 16.8 | 41% |
| Gulfton | 77081 | $460,000 | 48.40% | 5.70% | 52.3 | 6% |
| Heights/Greater Heights | 77008 | $110,000 | -4.30% | -2.20% | 101.1 | 53% |
| Hempstead | 77445 | $770,400 | 46.00% | 8.50% | 43.9 | 66% |
| Highland Village/Midlane | 77027 | $131,000 | 15.90% | 1.20% | 60.9 | 34% |
| Hitchcock | 77563 | $109,000 | 31.50% | 14.70% | 36.4 | 69% |
| Hobby Area | 77061 | $139,000 | 40.40% | 0.00% | 36.5 | 34% |
| Hockley | 77447 | $196,500 | 47.50% | 9.20% | 58.1 | 86% |
| Huffman Area | 77336 | $150,062 | 33.00% | 3.50% | 41.2 | 77% |
| Humble Area East | 77338 | $67,250 | 8.00% | -18.40% | 19.6 | 53% |
| Humble Area South | 77338 | $131,250 | 52.70% | 7.60% | 44.9 | 53% |
| Humble Area West | 77338 | $223,250 | 39.60% | 15.70% | 25.7 | 53% |
| Jersey Village | 77040 | $172,000 | 43.30% | 9.60% | 26.6 | 55% |
| Katy-North | 77449 | $225,000 | 49.80% | 5.10% | 53.5 | 74% |
| Katy-Old Towne | 77493 | $283,000 | 30.10% | 6.20% | 27.2 | 80% |
| Katy-Southeast | 77450 | $350,000 | 28.70% | 3.70% | 61.8 | 71% |
| Katy-Southwest | 77494 | $290,000 | 17.20% | 3.60% | 32.1 | 86% |
| Kingwood East | 77345 | $267,450 | 20.10% | 4.20% | 56.8 | 82% |
| Kingwood NW/Oakhurst | 77339 | $223,419 | 17.00% | 4.00% | 22.2 | 63% |
| Kingwood South | 77338 | $182,750 | 26.00% | 7.80% | 33.6 | 53% |
| Kingwood West | 77339 | $465,000 | 46.20% | 9.60% | 48.3 | 63% |
| Knollwood/Woodside Area | 77025 | $92,000 | 16.20% | 12.30% | 59.2 | 45% |
| La Marque | 77568 | $146,950 | 24.50% | 11.30% | 37 | 73% |
| La Porte/Shoreacres | 77571 | $225,000 | 24.00% | -2.20% | 63 | 75% |
| Lake Conroe Area | 77356 | $115,000 | 6.20% | -4.10% | 112.5 | 89% |
| Lake Livingston Area | 77351 | $230,500 | 24.60% | 8.30% | 42.4 | 80% |
| League City | 77573 | $120,000 | 18.20% | 7.10% | 91.1 | 73% |
| Liberty | 77575 | $260,429 | 21.10% | 7.20% | 44.6 | 75% |
| Magnolia/1488 East | 77354 | $234,950 | 38.20% | 3.50% | 48.4 | 88% |
| Magnolia/1488 West | 77355 | $345,000 | 45.30% | 5.20% | 33 | 82% |
| Medical Center Area | 77030 | $115,000 | 73.00% | 15.10% | 52.8 | 44% |
| Medical Center South | 77051 | $1,850,000 | 100.00% | -15.90% | 36.8 | 39% |
| Memorial Close In | 77024 | $1,290,000 | 35.40% | 1.60% | 77.3 | 70% |
| Memorial Park | 77007 | $1,606,250 | 65.60% | 6.10% | 52.4 | 50% |
| Memorial Villages | 77024 | $700,000 | 53.80% | 1.40% | 38.2 | 70% |
| Memorial West | 77079 | $420,900 | 40.10% | 0.70% | 32.9 | 66% |
| Meyerland Area | 77096 | $124,450 | 30.00% | -1.20% | 71.6 | 51% |
| Midtown-Galveston | 77550 | $439,000 | 66.00% | 15.50% | 58.4 | 40% |
| Midtown-Houston | 77004 | $155,900 | 38.00% | 10.60% | 25.9 | 33% |
| Mission Bend Area | 77083 | $173,900 | 43.70% | 3.50% | 31.8 | 71% |
| Missouri City Area | 77459 | $638,000 | 52.60% | 7.60% | 54.6 | 88% |
| Montrose | 77006 | $187,500 | 42.00% | 10.30% | 75.5 | 36% |
| Near West End-Galveston | 77554 | $125,000 | 40.30% | 14.70% | 42.7 | 62% |
| North Channel | 77015 | $89,000 | 64.80% | 18.70% | 50.8 | 53% |
| Northeast Houston | 77028 | $92,000 | 85.90% | 15.00% | 43 | 66% |
| Northside | 77092 | $128,000 | 43.80% | 11.20% | 36.1 | 39% |
| Northwest Houston | 77088 | $396,250 | 80.10% | 6.30% | 52.6 | 63% |
| Oak Forest East Area | 77018 | $249,000 | 67.10% | 15.00% | 30.7 | 67% |
| Oak Forest West Area | 77092 | $280,000 | 67.50% | 15.90% | 40.1 | 39% |
| Omega Bay | 77563 | $126,000 | 34.20% | 9.60% | 32.7 | 69% |
| Pasadena | 77506 | $239,888 | 32.50% | 10.00% | 33.3 | 40% |
| Pearland | 77581 | $129,500 | -1.10% | -33.80% | 87.2 | 75% |
| Plantersville Area | 77363 | $232,920 | 160.30% | 46.00% | 63.3 | 82% |
| Porter/New Caney East | 77357 | $188,900 | 52.60% | 7.70% | 53 | 73% |
| Porter/New Caney West | 77365 | $470,000 | 36.20% | 2.20% | 47.6 | 70% |
| Rice Military/Washington Corridor | 77007 | $745,000 | 24.30% | 0.00% | 55.6 | 50% |
| Rice/Museum District | 77005 | $1,926,000 | 58.80% | 2.00% | 74.5 | 73% |
| River Oaks Area | 77019 | $2,760,000 | 53.30% | 10.00% | 149.7 | 49% |
| Rivercrest | 77042 | $318,873 | 96.80% | 6.30% | 54.6 | 28% |
| Riverside | 77004 | $800,000 | -0.10% | 0.00% | 52.1 | 33% |
| Royden Oaks/Afton Oaks | 77027 | $168,383 | 25.70% | 11.50% | 45.3 | 34% |
| Santa Fe | 77510 | $174,750 | 56.00% | 9.90% | 31.7 | 83% |
| Sharpstown Area | 77036 | $416,000 | 54.10% | 5.20% | 34.7 | 21% |
| Shepherd Park Plaza Area | 77018 | $355,000 | 43.70% | 8.90% | 56 | 67% |
| Sienna Area | 77459 | $98,500 | 20.50% | 23.10% | 43.2 | 88% |
| South Houston | 77587 | $148,950 | 29.50% | 8.70% | 31 | 61% |
| Southbelt/Ellington | 77034 | $315,000 | 100.70% | 20.20% | 43.8 | 52% |
| Spring Branch | 77055 | $139,900 | 46.10% | 8.40% | 36.1 | 45% |
| Spring East | 77373 | $221,500 | 36.30% | 3.00% | 50.9 | 76% |
| Spring Northeast | 77386 | $200,000 | 32.50% | -1.50% | 43.1 | 78% |
| Spring/Klein | 77388 | $200,000 | 35.10% | 7.70% | 40.9 | 88% |
| Spring/Klein/Tomball | 77375 | $140,800 | 38.00% | 9.10% | 22.9 | 65% |
| Stafford Area | 77477 | $316,000 | 38.60% | 9.90% | 27.7 | 45% |
| Sugar Land East | 77478 | $222,750 | 48.50% | 21.70% | 28.6 | 82% |
| Sugar Land North | 77498 | $454,720 | 47.60% | 2.70% | 45.3 | 72% |
| Sugar Land South | 77479 | $315,000 | 26.30% | 2.60% | 45.9 | 84% |
| Sugar Land West | 77407 | $264,900 | 21.50% | 0.00% | 46.1 | 84% |
| Summerwood/Lakeshore | 77044 | $1,599,000 | 71.00% | -7.80% | 63 | 82% |
| Tanglewood Area | 77056 | $93,000 | 43.10% | 3.90% | 50.5 | 46% |
| Texas City | 77590 | $379,700 | 33.20% | 7.00% | 48.3 | 61% |
| The Woodlands | 77380 | $454,000 | 21.10% | 16.80% | 137.2 | 45% |
| Tiki Island | 77554 | $404,990 | 48.00% | 1.20% | 38.9 | 62% |
| Timbergrove/Lazybrook | 77008 | $220,000 | 42.50% | 18.90% | 56.8 | 53% |
| Tomball | 77375 | $250,000 | -5.70% | -20.00% | 106.8 | 65% |
| Treasure Island-Galveston | 77541 | $119,000 | 138.50% | 6.30% | 51.4 | 68% |
| Trinity Area | 75862 | $767,500 | 13.70% | -7.50% | 58.9 | 83% |
| Tyler County | 75979 | $179,000 | 65.40% | 6.40% | 54.2 | 76% |
| University Area | 77021 | $413,750 | 63.50% | 3.70% | 69.7 | 40% |
| Upper Kirby | 77098 | $235,000 | 68.80% | 47.80% | 49.3 | 30% |
| Waller | 77484 | $312,250 | 28.80% | -2.90% | 80.6 | 75% |
| Washington East/Sabine | 77007 | $1,223,500 | 59.90% | 9.60% | 38.6 | 50% |
| Webster | 77598 | $704,000 | 12.60% | -0.10% | 58.7 | 20% |
| West End-Galveston | 77554 | $140,000 | 60.90% | 21.70% | 51.2 | 62% |
| West University/Southside Area | 77005 | $315,500 | 44.10% | 7.50% | 32.7 | 73% |
| Westchase Area | 77042 | $145,000 | 29.60% | 8.20% | 25.8 | 28% |
| Willis/New Waverly | 77318/77378 | $140,000 | 60.90% | 21.70% | 51.2 | 74% |
| Willow Meadows Area | 77035 | $315,500 | 44.10% | 7.50% | 32.7 | 43% |
| Willowbrook | 77064 | $145,000 | 29.60% | 8.20% | 25.8 | 63% |
Demographics
| ZIP Code | Population | Median Income | Median Age | % Unemployed | % with Bachelor's Degrees | % Enrolled in Private Schools | % of Population Under 14 | |
|---|---|---|---|---|---|---|---|---|
| 1960/Cypress | 77065 | 38,585 | $56,341 | 33 | 5% | 27% | 9% | 23% |
| Aldine Area | 77039 | 28,711 | $37,275 | 27.2 | 9% | 4% | 3% | 28% |
| Alief | 77072 | 59,442 | $37,143 | 32.4 | 10% | 13% | 4% | 23% |
| Alvin North | 77511 | 46,333 | $51,203 | 34.9 | 7% | 17% | 6% | 22% |
| Alvin South | 77511 | 46,333 | $51,203 | 34.9 | 7% | 17% | 6% | 22% |
| Angelina County | 75901 | 30,494 | $44,887 | 33.9 | 9% | 16% | 5% | 24% |
| Atascocita North | 77346 | 57,329 | $87,878 | 33.4 | 5% | 36% | 13% | 25% |
| Atascocita South | 77396 | 47,623 | $57,440 | 30.8 | 7% | 24% | 10% | 26% |
| Bacliff/San Leon | 77518 | 8,667 | $40,421 | 31.7 | 8% | 16% | 6% | 28% |
| Bayou Vista | 77563 | 9,836 | $50,481 | 43.1 | 8% | 16% | 11% | 19% |
| Baytown/Chambers County | 77521 | 53,091 | $54,343 | 31.5 | 10% | 17% | 7% | 27% |
| Baytown/Harris County | 77520 | 37,928 | $43,094 | 32.4 | 11% | 10% | 6% | 24% |
| Bear Creek | 77449 | 99,450 | $66,550 | 30.4 | 8% | 23% | 9% | 27% |
| Bellaire | 77401 | 18,130 | $154,053 | 41.2 | 4% | 77% | 45% | 23% |
| Braeswood Place | 77025 | 27,413 | $65,524 | 35.3 | 5% | 67% | 32% | 19% |
| Brays Oaks | 77031 | 17,711 | $38,677 | 30.9 | 9% | 20% | 9% | 27% |
| Briargrove | 77057 | 40,086 | $52,624 | 33.9 | 5% | 52% | 29% | 16% |
| Briargrove Park/Walnut Bend | 77042 | 38,335 | $45,403 | 31.5 | 7% | 45% | 17% | 19% |
| Briarmeadow/Tanglewilde | 77063 | 36,299 | $46,611 | 32.9 | 6% | 46% | 22% | 18% |
| Brookshire | 77423 | 9,739 | $37,182 | 33.7 | 8% | 13% | 5% | 25% |
| Chambers County East | 77514 | 4,430 | $43,750 | 41.4 | 6% | 15% | 10% | 18% |
| Chambers County West | 77523 | 18,378 | $90,226 | 33.7 | 7% | 22% | 8% | 27% |
| Champions Area | 77069 | 16,764 | $64,498 | 47.1 | 5% | 49% | 20% | 14% |
| Charnwood/Briarbend | 77063 | 36,299 | $46,611 | 32.9 | 6% | 46% | 22% | 18% |
| Clear Lake Area | 77062 | 25,760 | $83,932 | 40.3 | 7% | 48% | 15% | 17% |
| Cleveland Area | 77327 | 21,089 | $42,902 | 35.6 | 14% | 10% | 5% | 23% |
| Coldspring/South San Jacinto County | 77331 | 6,124 | $41,611 | 54 | 10% | 18% | 0% | 13% |
| Conroe Northeast | 77301 | 31,796 | $34,579 | 31.8 | 6% | 10% | 5% | 24% |
| Conroe Southeast | 77301 | 31,796 | $34,579 | 31.8 | 6% | 10% | 5% | 24% |
| Conroe Southwest | 77304 | 24,426 | $59,278 | 36.6 | 3% | 33% | 18% | 19% |
| Copperfield Area | 77095 | 69,927 | $88,555 | 35 | 5% | 42% | 11% | 23% |
| Cottage Grove | 77007 | 31,987 | $106,044 | 34.3 | 3% | 67% | 30% | 10% |
| Crosby Area | 77532 | 28,394 | $62,313 | 34.8 | 8% | 18% | 9% | 23% |
| Crystal Beach | 77650 | 1,221 | $92,083 | 53.3 | 5% | 31% | 0% | 15% |
| Cypress North | 77429 | 76,437 | $98,191 | 34.2 | 3% | 45% | 10% | 26% |
| Cypress South | 77433 | 60,324 | $93,884 | 31.1 | 5% | 46% | 10% | 30% |
| Dayton | 77535 | 30,946 | $57,170 | 37.1 | 8% | 6% | 10% | 18% |
| Deer Park | 77536 | 31,960 | $79,251 | 34.7 | 7% | 20% | 8% | 23% |
| Denver Harbor | 77020 | 26,777 | $27,871 | 32.9 | 10% | 7% | 4% | 25% |
| Dickinson | 77539 | 41,090 | $67,525 | 35 | 8% | 23% | 11% | 22% |
| East End-Galveston | 77550 | 22,134 | $31,124 | 38.4 | 11% | 27% | 8% | 16% |
| Eldridge North | 77041 | 37,168 | $74,020 | 34.5 | 7% | 34% | 18% | 24% |
| Energy Corridor | 77077 | 53,659 | $62,784 | 34.5 | 6% | 53% | 28% | 18% |
| Fall Creek Area | 77396 | 47,623 | $57,440 | 30.8 | 7% | 24% | 10% | 26% |
| Five Corners | 77045 | 33,820 | $39,020 | 30.9 | 14% | 13% | 7% | 25% |
| Fort Bend County North/Richmond | 77469 | 38,364 | $70,142 | 33.8 | 4% | 26% | 14% | 22% |
| Fort Bend Southeast | 77469 | 38,364 | $70,142 | 33.8 | 4% | 26% | 14% | 22% |
| Friendswood | 77546 | 49,979 | $95,641 | 39.3 | 5% | 46% | 11% | 21% |
| Fulshear/South Brookshire/Simonton | 77441 | 5,647 | $136,080 | 47.9 | 4% | 54% | 18% | 20% |
| Galleria | 77056 | 17,515 | $92,521 | 40.8 | 5% | 74% | 48% | 9% |
| Garden Oaks | 77015 | 55,635 | $42,942 | 28.8 | 11% | 12% | 6% | 27% |
| Greenway Plaza | 77046 | 967 | $98,846 | 47.8 | 0% | 74% | 30% | 4% |
| Gulfton | 77081 | 44,070 | $27,191 | 29.6 | 7% | 17% | 5% | 28% |
| Heights/Greater Heights | 77008 | 31,418 | $77,512 | 35.5 | 4% | 56% | 24% | 15% |
| Hempstead | 77445 | 12,662 | $44,549 | 32.1 | 12% | 17% | 14% | 22% |
| Highland Village/Midlane | 77027 | 15,510 | $82,038 | 36.7 | 5% | 73% | 39% | 8% |
| Hitchcock | 77563 | 9,836 | $50,481 | 43.1 | 8% | 16% | 11% | 19% |
| Hobby Area | 77061 | 25,519 | $33,302 | 29.4 | 7% | 10% | 6% | 25% |
| Hockley | 77447 | 13,186 | $65,235 | 36.4 | 4% | 13% | 12% | 23% |
| Huffman Area | 77336 | 11,699 | $63,814 | 35.8 | 7% | 19% | 7% | 23% |
| Humble Area East | 77338 | 36,257 | $47,534 | 31.3 | 8% | 20% | 11% | 24% |
| Humble Area South | 77338 | 36,257 | $47,534 | 31.3 | 8% | 20% | 11% | 24% |
| Humble Area West | 77338 | 36,257 | $47,534 | 31.3 | 8% | 20% | 11% | 24% |
| Jersey Village | 77040 | 46,898 | $53,233 | 32.4 | 5% | 24% | 13% | 22% |
| Katy-North | 77449 | 99,450 | $66,550 | 30.4 | 8% | 23% | 9% | 27% |
| Katy-Old Towne | 77493 | 24,577 | $76,393 | 33.7 | 6% | 28% | 11% | 23% |
| Katy-Southeast | 77450 | 73,269 | $99,732 | 36.9 | 6% | 53% | 11% | 24% |
| Katy-Southwest | 77494 | 79,117 | $131,694 | 34.7 | 3% | 65% | 14% | 29% |
| Kingwood East | 77345 | 29,292 | $121,224 | 39.6 | 3% | 62% | 14% | 23% |
| Kingwood NW/Oakhurst | 77339 | 40,683 | $72,200 | 38.3 | 7% | 40% | 13% | 18% |
| Kingwood South | 77338 | 36,257 | $47,534 | 31.3 | 8% | 20% | 11% | 24% |
| Kingwood West | 77339 | 40,683 | $72,200 | 38.3 | 7% | 40% | 13% | 18% |
| Knollwood/Woodside Area | 77025 | 27,413 | $65,524 | 35.3 | 5% | 67% | 32% | 19% |
| La Marque | 77568 | 14,886 | $43,928 | 35.7 | 11% | 15% | 6% | 23% |
| La Porte/Shoreacres | 77571 | 36,580 | $69,480 | 36.1 | 8% | 15% | 11% | 21% |
| Lake Conroe Area | 77356 | 24,851 | $82,181 | 48.2 | 8% | 40% | 12% | 16% |
| Lake Livingston Area | 77351 | 32,683 | $41,661 | 43.6 | 9% | 13% | 10% | 16% |
| League City | 77573 | 75,772 | $93,178 | 35.6 | 4% | 42% | 13% | 23% |
| Liberty | 77575 | 16,725 | $45,792 | 34.7 | 9% | 14% | 8% | 23% |
| Magnolia/1488 East | 77354 | 34,551 | $77,650 | 36 | 8% | 30% | 16% | 23% |
| Magnolia/1488 West | 77355 | 25,855 | $71,973 | 38.7 | 8% | 24% | 13% | 23% |
| Medical Center Area | 77030 | 10,664 | $71,078 | 32.5 | 4% | 82% | 38% | 15% |
| Medical Center South | 77051 | 15,216 | $23,237 | 34.3 | 19% | 9% | 5% | 22% |
| Memorial Close In | 77024 | 36,791 | $114,864 | 44.5 | 4% | 72% | 31% | 20% |
| Memorial Park | 77007 | 31,987 | $106,044 | 34.3 | 3% | 67% | 30% | 10% |
| Memorial Villages | 77024 | 36,791 | $114,864 | 44.5 | 4% | 72% | 31% | 20% |
| Memorial West | 77079 | 31,002 | $99,650 | 41.1 | 5% | 65% | 23% | 21% |
| Meyerland Area | 77096 | 36,227 | $59,556 | 36.8 | 7% | 51% | 24% | 21% |
| Midtown-Galveston | 77550 | 22,134 | $31,124 | 38.4 | 11% | 27% | 8% | 16% |
| Midtown-Houston | 77004 | 34,079 | $46,059 | 29 | 10% | 46% | 15% | 11% |
| Mission Bend Area | 77083 | 73,164 | $52,075 | 32.5 | 7% | 26% | 8% | 24% |
| Missouri City Area | 77459 | 59,800 | $107,214 | 37 | 6% | 54% | 15% | 23% |
| Montrose | 77006 | 21,144 | $69,508 | 35.4 | 3% | 66% | 33% | 7% |
| Near West End-Galveston | 77554 | 8,599 | $63,405 | 48.2 | 6% | 42% | 19% | 8% |
| North Channel | 77015 | 55,635 | $42,942 | 28.8 | 11% | 12% | 6% | 27% |
| Northeast Houston | 77028 | 15,076 | $31,440 | 38.6 | 16% | 6% | 3% | 22% |
| Northside | 77092 | 35,087 | $37,383 | 32.4 | 7% | 16% | 5% | 23% |
| Northwest Houston | 77088 | 53,887 | $42,447 | 32.4 | 12% | 13% | 6% | 26% |
| Oak Forest East Area | 77018 | 27,020 | $65,919 | 38.5 | 4% | 38% | 25% | 19% |
| Oak Forest West Area | 77092 | 35,087 | $37,383 | 32.4 | 7% | 16% | 5% | 23% |
| Omega Bay | 77563 | 9,836 | $50,481 | 43.1 | 8% | 16% | 11% | 19% |
| Pasadena | 77506 | 36,225 | $29,965 | 27.7 | 12% | 4% | 2% | 29% |
| Pearland | 77581 | 44,451 | $86,857 | 35.8 | 4% | 32% | 12% | 23% |
| Plantersville Area | 77363 | 3,471 | $41,714 | 38.9 | 9% | 13% | 13% | 26% |
| Porter/New Caney East | 77357 | 5,225 | $54,224 | 41.3 | 5% | 21% | 7% | 18% |
| Porter/New Caney West | 77365 | 26,175 | $59,071 | 34.1 | 8% | 18% | 11% | 23% |
| Rice Military/Washington Corridor | 77007 | 31,987 | $106,044 | 34.3 | 3% | 67% | 30% | 10% |
| Rice/Museum District | 77005 | 26,187 | $163,802 | 38.7 | 3% | 85% | 60% | 19% |
| River Oaks Area | 77019 | 20,350 | $92,844 | 37.9 | 3% | 69% | 52% | 12% |
| Rivercrest | 77042 | 38,335 | $45,403 | 31.5 | 7% | 45% | 17% | 19% |
| Riverside | 77004 | 34,079 | $46,059 | 29 | 10% | 46% | 15% | 11% |
| Royden Oaks/Afton Oaks | 77027 | 15,510 | $82,038 | 36.7 | 5% | 73% | 39% | 8% |
| Santa Fe | 77510 | 14,533 | $57,205 | 43.8 | 11% | 13% | 8% | 18% |
| Sharpstown Area | 77036 | 72,950 | $27,935 | 29.2 | 10% | 16% | 5% | 27% |
| Shepherd Park Plaza Area | 77018 | 27,020 | $65,919 | 38.5 | 4% | 38% | 25% | 19% |
| Sienna Area | 77459 | 59,800 | $107,214 | 37 | 6% | 54% | 15% | 23% |
| South Houston | 77587 | 17,052 | $38,750 | 27.4 | 9% | 7% | 3% | 28% |
| Southbelt/Ellington | 77034 | 37,925 | $44,827 | 28.2 | 8% | 13% | 8% | 28% |
| Spring Branch | 77055 | 44,249 | $45,264 | 32.9 | 7% | 29% | 11% | 25% |
| Spring East | 77373 | 55,485 | $67,464 | 33.2 | 7% | 22% | 7% | 25% |
| Spring Northeast | 77386 | 44,686 | $84,940 | 31.5 | 4% | 40% | 13% | 29% |
| Spring/Klein | 77388 | 41,866 | $82,059 | 36.8 | 5% | 36% | 13% | 22% |
| Spring/Klein/Tomball | 77375 | 43,088 | $61,941 | 32 | 7% | 27% | 9% | 29% |
| Stafford Area | 77477 | 35,608 | $54,913 | 33.5 | 5% | 33% | 12% | 20% |
| Sugar Land East | 77478 | 24,084 | $89,295 | 45.5 | 5% | 49% | 21% | 17% |
| Sugar Land North | 77498 | 52,693 | $73,383 | 34.1 | 4% | 33% | 12% | 22% |
| Sugar Land South | 77479 | 81,466 | $128,362 | 38.5 | 4% | 61% | 18% | 22% |
| Sugar Land West | 77407 | 35,057 | $85,045 | 32.4 | 7% | 44% | 18% | 28% |
| Summerwood/Lakeshore | 77044 | 35,696 | $74,455 | 29.6 | 8% | 27% | 10% | 31% |
| Tanglewood Area | 77056 | 17,515 | $92,521 | 40.8 | 5% | 74% | 48% | 9% |
| Texas City | 77590 | 30,675 | $44,010 | 37.3 | 12% | 12% | 9% | 22% |
| The Woodlands | 77380 | 26,091 | $68,759 | 36.6 | 5% | 42% | 20% | 18% |
| Tiki Island | 77554 | 8,599 | $63,405 | 48.2 | 6% | 42% | 19% | 8% |
| Timbergrove/Lazybrook | 77008 | 31,418 | $77,512 | 35.5 | 4% | 56% | 24% | 15% |
| Tomball | 77375 | 43,088 | $61,941 | 32 | 7% | 27% | 9% | 29% |
| Treasure Island-Galveston | 77541 | 17,826 | $42,014 | 34.8 | 9% | 9% | 4% | 23% |
| Trinity Area | 75862 | 8,439 | $35,223 | 54.9 | 8% | 11% | 2% | 12% |
| Tyler County | 75979 | 11,695 | $39,282 | 39.7 | 12% | 11% | 10% | 15% |
| University Area | 77021 | 26,036 | $32,391 | 33.7 | 13% | 23% | 10% | 19% |
| Upper Kirby | 77098 | 13,091 | $82,017 | 35.4 | 5% | 76% | 28% | 8% |
| Waller | 77484 | 11,370 | $64,768 | 39.3 | 4% | 18% | 16% | 23% |
| Washington East/Sabine | 77007 | 31,987 | $106,044 | 34.3 | 3% | 67% | 30% | 10% |
| Webster | 77598 | 24,538 | $46,161 | 29 | 7% | 26% | 10% | 23% |
| West End-Galveston | 77554 | 8,599 | $63,405 | 48.2 | 6% | 42% | 19% | 8% |
| West University/Southside Area | 77005 | 26,187 | $163,802 | 38.7 | 3% | 85% | 60% | 19% |
| Westchase Area | 77042 | 38,335 | $45,403 | 31.5 | 7% | 45% | 17% | 19% |
| Willis/New Waverly | 77318/77378 | 13,804 | $46,481 | 35.8 | 5% | 15% | 10% | 23% |
| Willow Meadows Area | 77035 | 35,989 | $37,962 | 32.3 | 12% | 27% | 8% | 24% |
| Willowbrook | 77064 | 46,509 | $64,234 | 33.4 | 4% | 31% | 9% | 22% |
Transportation
| ZIP Code | % Using Public Transportation | % Carpooling | Avg. Commute (in Minutes) | Walkability Score | |
|---|---|---|---|---|---|
| 1960/Cypress | 77065 | 2% | 11% | 27 | 40 |
| Aldine Area | 77039 | 2% | 11% | 29 | 19 |
| Alief | 77072 | 5% | 17% | 30 | 47 |
| Alvin North | 77511 | 0% | 10% | 31 | 34 |
| Alvin South | 77511 | 0% | 10% | 31 | 45 |
| Angelina County | 75901 | 0% | 13% | 17 | 54 |
| Atascocita North | 77346 | 1% | 7% | 32 | 70 |
| Atascocita South | 77396 | 2% | 12% | 31 | 20 |
| Bacliff/San Leon | 77518 | 1% | 21% | 32 | 48 |
| Bayou Vista | 77563 | 0% | 12% | 26 | 24 |
| Baytown/Chambers County | 77521 | 1% | 10% | 23 | 1 |
| Baytown/Harris County | 77520 | 1% | 11% | 23 | 69 |
| Bear Creek | 77449 | 2% | 12% | 33 | 36 |
| Bellaire | 77401 | 1% | 7% | 21 | 48 |
| Braeswood Place | 77025 | 6% | 7% | 22 | 53 |
| Brays Oaks | 77031 | 6% | 27% | 27 | 50 |
| Briargrove | 77057 | 5% | 13% | 22 | 57 |
| Briargrove Park/Walnut Bend | 77042 | 4% | 7% | 25 | 49 |
| Briarmeadow/Tanglewilde | 77063 | 9% | 8% | 26 | 81 |
| Brookshire | 77423 | 1% | 14% | 29 | 54 |
| Chambers County East | 77514 | 0% | 6% | 25 | 2 |
| Chambers County West | 77523 | 0% | 7% | 35 | 33 |
| Champions Area | 77069 | 4% | 5% | 31 | 69 |
| Charnwood/Briarbend | 77063 | 9% | 8% | 26 | 62 |
| Clear Lake Area | 77062 | 1% | 11% | 25 | 32 |
| Cleveland Area | 77327 | 0% | 14% | 35 | 58 |
| Coldspring/South San Jacinto County | 77331 | 0% | 9% | 36 | 37 |
| Conroe Northeast | 77301 | 1% | 20% | 26 | 76 |
| Conroe Southeast | 77301 | 1% | 20% | 26 | 76 |
| Conroe Southwest | 77304 | 1% | 13% | 27 | 41 |
| Copperfield Area | 77095 | 2% | 11% | 33 | 62 |
| Cottage Grove | 77007 | 2% | 8% | 21 | 61 |
| Crosby Area | 77532 | 0% | 10% | 32 | 38 |
| Crystal Beach | 77650 | 0% | 16% | 34 | 10 |
| Cypress North | 77429 | 2% | 7% | 32 | 12 |
| Cypress South | 77433 | 2% | 10% | 35 | 50 |
| Dayton | 77535 | 0% | 10% | 37 | 47 |
| Deer Park | 77536 | 0% | 8% | 23 | 31 |
| Denver Harbor | 77020 | 5% | 25% | 28 | 53 |
| Dickinson | 77539 | 1% | 11% | 30 | 54 |
| East End-Galveston | 77550 | 3% | 10% | 18 | 75 |
| Eldridge North | 77041 | 2% | 9% | 27 | 32 |
| Energy Corridor | 77077 | 2% | 7% | 26 | 43 |
| Fall Creek Area | 77396 | 2% | 12% | 31 | 20 |
| Five Corners | 77045 | 5% | 11% | 30 | 29 |
| Fort Bend County North/Richmond | 77469 | 0% | 13% | 30 | 27 |
| Fort Bend Southeast | 77469 | 0% | 13% | 30 | 27 |
| Friendswood | 77546 | 1% | 8% | 30 | 50 |
| Fulshear/South Brookshire/Simonton | 77441 | 1% | 8% | 37 | 43 |
| Galleria | 77056 | 4% | 5% | 19 | 85 |
| Garden Oaks | 77015 | 1% | 13% | 26 | 55 |
| Greenway Plaza | 77046 | 3% | 1% | 15 | 86 |
| Gulfton | 77081 | 9% | 15% | 27 | 62 |
| Heights/Greater Heights | 77008 | 3% | 8% | 22 | 67 |
| Hempstead | 77445 | 0% | 15% | 30 | 51 |
| Highland Village/Midlane | 77027 | 1% | 6% | 19 | 75 |
| Hitchcock | 77563 | 0% | 12% | 26 | 7 |
| Hobby Area | 77061 | 7% | 12% | 29 | 44 |
| Hockley | 77447 | 1% | 9% | 44 | 9 |
| Huffman Area | 77336 | 2% | 12% | 36 | 23 |
| Humble Area East | 77338 | 1% | 19% | 27 | 68 |
| Humble Area South | 77338 | 1% | 19% | 27 | 39 |
| Humble Area West | 77338 | 1% | 19% | 27 | 86 |
| Jersey Village | 77040 | 1% | 11% | 28 | 44 |
| Katy-North | 77449 | 2% | 12% | 33 | 13 |
| Katy-Old Towne | 77493 | 2% | 10% | 32 | 48 |
| Katy-Southeast | 77450 | 4% | 9% | 31 | 48 |
| Katy-Southwest | 77494 | 2% | 11% | 35 | 65 |
| Kingwood East | 77345 | 5% | 6% | 36 | 26 |
| Kingwood NW/Oakhurst | 77339 | 2% | 8% | 30 | 29 |
| Kingwood South | 77338 | 1% | 19% | 27 | 68 |
| Kingwood West | 77339 | 2% | 8% | 30 | 34 |
| Knollwood/Woodside Area | 77025 | 6% | 7% | 22 | 40 |
| La Marque | 77568 | 0% | 11% | 25 | 54 |
| La Porte/Shoreacres | 77571 | 0% | 10% | 25 | 56 |
| Lake Conroe Area | 77356 | 0% | 7% | 38 | 25 |
| Lake Livingston Area | 77351 | 1% | 16% | 25 | 4 |
| League City | 77573 | 2% | 8% | 29 | 58 |
| Liberty | 77575 | 0% | 16% | 28 | 57 |
| Magnolia/1488 East | 77354 | 1% | 10% | 35 | 47 |
| Magnolia/1488 West | 77355 | 1% | 7% | 40 | 48 |
| Medical Center Area | 77030 | 8% | 9% | 19 | 59 |
| Medical Center South | 77051 | 8% | 7% | 26 | 70 |
| Memorial Close In | 77024 | 1% | 5% | 21 | 62 |
| Memorial Park | 77007 | 2% | 8% | 21 | 37 |
| Memorial Villages | 77024 | 1% | 5% | 21 | 59 |
| Memorial West | 77079 | 2% | 7% | 23 | 56 |
| Meyerland Area | 77096 | 6% | 6% | 25 | 53 |
| Midtown-Galveston | 77550 | 3% | 10% | 18 | 52 |
| Midtown-Houston | 77004 | 10% | 4% | 21 | 82 |
| Mission Bend Area | 77083 | 1% | 12% | 32 | 61 |
| Missouri City Area | 77459 | 2% | 9% | 33 | 11 |
| Montrose | 77006 | 4% | 5% | 19 | 93 |
| Near West End-Galveston | 77554 | 1% | 9% | 27 | 75 |
| North Channel | 77015 | 1% | 13% | 26 | 47 |
| Northeast Houston | 77028 | 7% | 8% | 27 | 30 |
| Northside | 77092 | 4% | 13% | 26 | 46 |
| Northwest Houston | 77088 | 3% | 11% | 29 | 47 |
| Oak Forest East Area | 77018 | 2% | 8% | 25 | 64 |
| Oak Forest West Area | 77092 | 4% | 13% | 26 | 74 |
| Omega Bay | 77563 | 0% | 12% | 26 | 2 |
| Pasadena | 77506 | 0% | 17% | 26 | 43 |
| Pearland | 77581 | 0% | 7% | 29 | 21 |
| Plantersville Area | 77363 | 0% | 8% | 35 | 18 |
| Porter/New Caney East | 77357 | 0% | 11% | 31 | 30 |
| Porter/New Caney West | 77365 | 0% | 17% | 29 | 13 |
| Rice Military/Washington Corridor | 77007 | 2% | 8% | 21 | 79 |
| Rice/Museum District | 77005 | 1% | 4% | 18 | 76 |
| River Oaks Area | 77019 | 2% | 5% | 18 | 39 |
| Rivercrest | 77042 | 4% | 7% | 25 | 70 |
| Riverside | 77004 | 10% | 4% | 21 | 69 |
| Royden Oaks/Afton Oaks | 77027 | 1% | 6% | 19 | 76 |
| Santa Fe | 77510 | 0% | 6% | 28 | 39 |
| Sharpstown Area | 77036 | 6% | 28% | 27 | 60 |
| Shepherd Park Plaza Area | 77018 | 2% | 8% | 25 | 62 |
| Sienna Area | 77459 | 2% | 9% | 33 | 11 |
| South Houston | 77587 | 1% | 18% | 26 | 72 |
| Southbelt/Ellington | 77034 | 2% | 16% | 27 | 61 |
| Spring Branch | 77055 | 4% | 17% | 24 | 55 |
| Spring East | 77373 | 2% | 11% | 31 | 57 |
| Spring Northeast | 77386 | 2% | 8% | 34 | 55 |
| Spring/Klein | 77388 | 3% | 9% | 33 | 45 |
| Spring/Klein/Tomball | 77375 | 1% | 10% | 31 | 15 |
| Stafford Area | 77477 | 2% | 8% | 25 | 65 |
| Sugar Land East | 77478 | 2% | 11% | 27 | 25 |
| Sugar Land North | 77498 | 1% | 11% | 30 | 58 |
| Sugar Land South | 77479 | 2% | 10% | 30 | 39 |
| Sugar Land West | 77407 | 1% | 11% | 36 | 16 |
| Summerwood/Lakeshore | 77044 | 2% | 13% | 31 | 28 |
| Tanglewood Area | 77056 | 4% | 5% | 19 | 78 |
| Texas City | 77590 | 0% | 17% | 22 | 30 |
| The Woodlands | 77380 | 2% | 10% | 26 | 17 |
| Tiki Island | 77554 | 1% | 9% | 27 | 0 |
| Timbergrove/Lazybrook | 77008 | 3% | 8% | 22 | 70 |
| Tomball | 77375 | 1% | 10% | 31 | 15 |
| Treasure Island-Galveston | 77541 | 1% | 11% | 20 | 0 |
| Trinity Area | 75862 | 0% | 14% | 28 | 8 |
| Tyler County | 75979 | 1% | 22% | 29 | 42 |
| University Area | 77021 | 11% | 11% | 25 | 70 |
| Upper Kirby | 77098 | 5% | 5% | 20 | 81 |
| Waller | 77484 | 1% | 6% | 35 | 44 |
| Washington East/Sabine | 77007 | 2% | 8% | 21 | 61 |
| Webster | 77598 | 1% | 13% | 23 | 57 |
| West End-Galveston | 77554 | 1% | 9% | 27 | 10 |
| West University/Southside Area | 77005 | 1% | 4% | 18 | 65 |
| Westchase Area | 77042 | 4% | 7% | 25 | 35 |
| Willis/New Waverly | 77318/77378 | 0% | 10% | 28 | 35/12 |
| Willow Meadows Area | 77035 | 8% | 18% | 27 | 75 |
| Willowbrook | 77064 | 1% | 10% | 27 | 45 |
Lifestyle
| ZIP Code | No. of Supermarkets | No. of Parks | No. of Libraries | |
|---|---|---|---|---|
| 1960/Cypress | 77065 | 9 | 2 | 1 |
| Aldine Area | 77039 | 5 | 2 | 1 |
| Alief | 77072 | 7 | 4 | 1 |
| Alvin North | 77511 | 6 | 12 | 1 |
| Alvin South | 77511 | 6 | 12 | 1 |
| Angelina County | 75901 | 2 | 5 | 1 |
| Atascocita North | 77346 | 8 | 0 | 1 |
| Atascocita South | 77396 | 4 | 4 | 0 |
| Bacliff/San Leon | 77518 | 7 | 0 | 0 |
| Bayou Vista | 77563 | 3 | 4 | 1 |
| Baytown/Chambers County | 77521 | 6 | 14 | 1 |
| Baytown/Harris County | 77520 | 2 | 22 | 2 |
| Bear Creek | 77449 | 8 | 4 | 0 |
| Bellaire | 77401 | 8 | 14 | 1 |
| Braeswood Place | 77025 | 8 | 4 | 1 |
| Brays Oaks | 77031 | 5 | 0 | 0 |
| Briargrove | 77057 | 5 | 1 | 1 |
| Briargrove Park/Walnut Bend | 77042 | 6 | 1 | 1 |
| Briarmeadow/Tanglewilde | 77063 | 5 | 3 | 0 |
| Brookshire | 77423 | 6 | 2 | 1 |
| Chambers County East | 77514 | 0 | 3 | 2 |
| Chambers County West | 77523 | 5 | 2 | 0 |
| Champions Area | 77069 | 8 | 0 | 0 |
| Charnwood/Briarbend | 77063 | 5 | 3 | 0 |
| Clear Lake Area | 77062 | 4 | 1 | 2 |
| Cleveland Area | 77327 | 2 | 3 | 1 |
| Coldspring/South San Jacinto County | 77331 | 1 | 3 | 1 |
| Conroe Northeast | 77301 | 4 | 6 | 1 |
| Conroe Southeast | 77301 | 4 | 6 | 1 |
| Conroe Southwest | 77304 | 9 | 2 | 0 |
| Copperfield Area | 77095 | 8 | 1 | 0 |
| Cottage Grove | 77007 | 7 | 13 | 0 |
| Crosby Area | 77532 | 9 | 2 | 1 |
| Crystal Beach | 77650 | 2 | 2 | 0 |
| Cypress North | 77429 | 8 | 5 | 1 |
| Cypress South | 77433 | 9 | 5 | 1 |
| Dayton | 77535 | 3 | 4 | 1 |
| Deer Park | 77536 | 5 | 3 | 1 |
| Denver Harbor | 77020 | 2 | 4 | 3 |
| Dickinson | 77539 | 4 | 4 | 2 |
| East End-Galveston | 77550 | 2 | 11 | 1 |
| Eldridge North | 77041 | 7 | 3 | 0 |
| Energy Corridor | 77077 | 7 | 13 | 0 |
| Fall Creek Area | 77396 | 4 | 4 | 0 |
| Five Corners | 77045 | 8 | 3 | 1 |
| Fort Bend County North/Richmond | 77469 | 7 | 2 | 2 |
| Fort Bend Southeast | 77469 | 7 | 2 | 2 |
| Friendswood | 77546 | 7 | 11 | 1 |
| Fulshear/South Brookshire/Simonton | 77441 | 9 | 2 | 1 |
| Galleria | 77056 | 6 | 2 | 0 |
| Garden Oaks | 77015 | 6 | 11 | 0 |
| Greenway Plaza | 77046 | 9 | 0 | 0 |
| Gulfton | 77081 | 5 | 1 | 1 |
| Heights/Greater Heights | 77008 | 8 | 8 | 1 |
| Hempstead | 77445 | 2 | 0 | 1 |
| Highland Village/Midlane | 77027 | 8 | 1 | 2 |
| Hitchcock | 77563 | 3 | 4 | 1 |
| Hobby Area | 77061 | 5 | 3 | 0 |
| Hockley | 77447 | 7 | 2 | 0 |
| Huffman Area | 77336 | 8 | 1 | 0 |
| Humble Area East | 77338 | 3 | 2 | 2 |
| Humble Area South | 77338 | 3 | 2 | 2 |
| Humble Area West | 77338 | 3 | 2 | 2 |
| Jersey Village | 77040 | 6 | 3 | 1 |
| Katy-North | 77449 | 8 | 4 | 0 |
| Katy-Old Towne | 77493 | 9 | 8 | 1 |
| Katy-Southeast | 77450 | 9 | 6 | 1 |
| Katy-Southwest | 77494 | 9 | 4 | 1 |
| Kingwood East | 77345 | 9 | 2 | 0 |
| Kingwood NW/Oakhurst | 77339 | 9 | 3 | 2 |
| Kingwood South | 77338 | 3 | 2 | 2 |
| Kingwood West | 77339 | 9 | 3 | 2 |
| Knollwood/Woodside Area | 77025 | 8 | 4 | 1 |
| La Marque | 77568 | 5 | 7 | 1 |
| La Porte/Shoreacres | 77571 | 4 | 11 | 1 |
| Lake Conroe Area | 77356 | 4 | 3 | 1 |
| Lake Livingston Area | 77351 | 1 | 4 | 1 |
| League City | 77573 | 9 | 6 | 1 |
| Liberty | 77575 | 3 | 2 | 1 |
| Magnolia/1488 East | 77354 | 6 | 3 | 1 |
| Magnolia/1488 West | 77355 | 3 | 4 | 0 |
| Medical Center Area | 77030 | 10 | 2 | 2 |
| Medical Center South | 77051 | 3 | 4 | 1 |
| Memorial Close In | 77024 | 8 | 5 | 1 |
| Memorial Park | 77007 | 7 | 13 | 0 |
| Memorial Villages | 77024 | 8 | 5 | 1 |
| Memorial West | 77079 | 6 | 3 | 1 |
| Meyerland Area | 77096 | 9 | 4 | 1 |
| Midtown-Galveston | 77550 | 2 | 11 | 1 |
| Midtown-Houston | 77004 | 5 | 8 | 3 |
| Mission Bend Area | 77083 | 5 | 2 | 0 |
| Missouri City Area | 77459 | 8 | 20 | 1 |
| Montrose | 77006 | 9 | 6 | 3 |
| Near West End-Galveston | 77554 | 2 | 3 | 0 |
| North Channel | 77015 | 6 | 11 | 0 |
| Northeast Houston | 77028 | 2 | 8 | 1 |
| Northside | 77092 | 5 | 10 | 1 |
| Northwest Houston | 77088 | 5 | 4 | 2 |
| Oak Forest East Area | 77018 | 7 | 5 | 1 |
| Oak Forest West Area | 77092 | 5 | 10 | 1 |
| Omega Bay | 77563 | 3 | 4 | 1 |
| Pasadena | 77506 | 8 | 10 | 2 |
| Pearland | 77581 | 8 | 4 | 1 |
| Plantersville Area | 77363 | 1 | 0 | 0 |
| Porter/New Caney East | 77357 | 4 | 2 | 1 |
| Porter/New Caney West | 77365 | 8 | 1 | 0 |
| Rice Military/Washington Corridor | 77007 | 7 | 13 | 0 |
| Rice/Museum District | 77005 | 8 | 6 | 4 |
| River Oaks Area | 77019 | 10 | 13 | 1 |
| Rivercrest | 77042 | 6 | 1 | 1 |
| Riverside | 77004 | 5 | 8 | 3 |
| Royden Oaks/Afton Oaks | 77027 | 8 | 1 | 2 |
| Santa Fe | 77510 | 5 | 1 | 1 |
| Sharpstown Area | 77036 | 7 | 3 | 1 |
| Shepherd Park Plaza Area | 77018 | 7 | 5 | 1 |
| Sienna Area | 77459 | 8 | 20 | 1 |
| South Houston | 77587 | 3 | 2 | 1 |
| Southbelt/Ellington | 77034 | 4 | 3 | 0 |
| Spring Branch | 77055 | 5 | 5 | 2 |
| Spring East | 77373 | 8 | 5 | 0 |
| Spring Northeast | 77386 | 8 | 2 | 0 |
| Spring/Klein | 77388 | 7 | 3 | 0 |
| Spring/Klein/Tomball | 77375 | 9 | 2 | 1 |
| Stafford Area | 77477 | 3 | 1 | 1 |
| Sugar Land East | 77478 | 6 | 8 | 1 |
| Sugar Land North | 77498 | 6 | 4 | 1 |
| Sugar Land South | 77479 | 8 | 14 | 2 |
| Sugar Land West | 77407 | 9 | 0 | 0 |
| Summerwood/Lakeshore | 77044 | 6 | 6 | 0 |
| Tanglewood Area | 77056 | 6 | 2 | 0 |
| Texas City | 77590 | 3 | 19 | 1 |
| The Woodlands | 77380 | 6 | 7 | 1 |
| Tiki Island | 77554 | 2 | 3 | 0 |
| Timbergrove/Lazybrook | 77008 | 8 | 8 | 1 |
| Tomball | 77375 | 9 | 2 | 1 |
| Treasure Island-Galveston | 77541 | 4 | 9 | 1 |
| Trinity Area | 75862 | 2 | 1 | 1 |
| Tyler County | 75979 | 1 | 2 | 1 |
| University Area | 77021 | 7 | 7 | 1 |
| Upper Kirby | 77098 | 10 | 2 | 0 |
| Waller | 77484 | 4 | 1 | 1 |
| Washington East/Sabine | 77007 | 7 | 13 | 0 |
| Webster | 77598 | 6 | 3 | 0 |
| West End-Galveston | 77554 | 2 | 3 | 0 |
| West University/Southside Area | 77005 | 8 | 6 | 4 |
| Westchase Area | 77042 | 6 | 1 | 1 |
| Willis/New Waverly | 77318/77378 | 5 | 1 | 1 |
| Willow Meadows Area | 77035 | 7 | 4 | 1 |
| Willowbrook | 77064 | 6 | 2 | 0 |
Neighborhoods & Real Estate
The Houston Association of Realtors provided our list of 149 neighborhoods. Our real estate data—including median home prices, percentage growth, and average days on the market—also came from HAR. Percentage of owner-occupied homes comes from the 2010 United States Census.
People
Demographic data—including population, median income, median age, percentage of population under 14 and percentage of unemployed residents in each neighborhood—comes from the 2010 U.S. Census and the 2015 American Community Survey.
Transportation & Lifestyle
Walkability scores come from the website walkscore.com, which uses a 100-point rating system (higher is better). Scores reflect an average for each ZIP code. Other lifestyle data—including percentage of residents with bachelor’s degrees, percentage enrolled in private school, percentage carpooling, average commute time and percentage using public transportation—come from the 2010 U.S. Census and the 2015 American Community Survey. The number of supermarkets and number of parks per ZIP code was compiled by Houstonia staff using Google Maps and the Houston Public Library system.